Saturday, November 17, 2018

Attribute Sampling & Variable Sampling


Attribute Sampling
In attribute sampling, data is in the “attribute” form, and the result either conforms or does not conform.


Attribute data is the simplest kind. You sample some number of items and you classify each item as either having some attribute, like being defective, or not. You will have some standard for what a defective item is -- like broken, scratched, non-functional, etc.

Variable Sampling
In variable sampling, data is in the “variable” form, and the result is rated on a continuous scale that measures the degree of conformity.

Variable sampling is about checking “how much”, “how good”, or “how bad”.

Variables data contains more information than attribute data per data-point. This is because it allows you to assess "how much" or "how bad" or "how good" rather than just "yes its defective" or "no its not defective".

Examples
Is the color black or not, is attribute data. What shade of gray it is, is variable data.

Quality Report v/s Quality Control Report

Quality reports would summarize the outcomes of QA type activities, so for example, they might report on the effectiveness of current QC practices or processes at meeting quality objectives. 

QC measurements are the outcomes of measurement. For example, if we are reporting defects on a software project, QC measurements might be the weekly count of defects over a period of time. 

Saturday, April 9, 2016

Quality CMMI-Six Sigma

Capability Maturity Model Integration (CMMI)
Capability Maturity Model Integration (CMMI) is a process improvement training and appraisal program and service administered and marketed by Carnegie Mellon University (CMU) and required by many DoD and U.S. Government contracts, especially in software development.

CMU claims CMMI can be used to guide process improvement across a project, division, or an entire organization. CMMI defines the following maturity levels for processes: Initial, Managed and Defined. Currently supported is CMMI Version 1.3.

CMMI currently addresses three areas of interest:

  1. Product and service development — CMMI for Development (CMMI-DEV),
  2. Service establishment, management, — CMMI for Services (CMMI-SVC), 
  3. Product and service acquisition — CMMI for Acquisition (CMMI-ACQ).

CMMI was developed by a group of experts from industry, government, and the Software Engineering Institute (SEI) at CMU.
CMMI models provide guidance for developing or improving processes that meet the business goals of an organization.
A CMMI model may also be used as a framework for appraising the process maturity of the organization.[1]
By January of 2013, the entire CMMI product suite was transferred from the SEI to the CMMI Institute, a newly created organization at Carnegie Mellon.[2]

CMMI originated in software engineering but has been highly generalized over the years to embrace other areas of interest, such as the development of hardware products, the delivery of all kinds of services, and the acquisition of products and services. The word "software" does not appear in definitions of CMMI. This generalization of improvement concepts makes CMMI extremely abstract. It is not as specific to software engineering any longer.


What Is Six Sigma?
“Six Sigma is a quality program that, when all is said and done, improves your customer’s experience, lowers your costs, and builds better leaders. — Jack Welch

Six Sigma’s DMAIC  (Define, Measure, Analyze, Improve, Control) process, 
  • a problem is first defined and quantified; 
  • then measurement data is collected to bound and clarify the problem; 
  • analytical tools are deployed to trace the problem to the root cause; 
  • a solution for the root cause is identified and implemented; 
  • and finally, the improved operations are subjected to ongoing control to prevent recurrence. 
The Six Sigma toolkit includes a variety of techniques, primarily from statistical data analysis and quality improvement. Design of experiments (DOE), failure mode and effects analysis (FMEA), cause-and-effect diagram (aka fishbone diagram, Ishikawa diagram), process flow diagram and gage repeatability and reproducibility (R&R) studies are among Six Sigma’s many tools.


Integration of Project Management and Six Sigma:
By taking the process control strength of project management and combining it with the troubleshooting strength of Six Sigma, an organization can create a consistent, controlled and predictable process troubleshooting system. The integration can begin with the development of a project life cycle. Implementing the Six Sigma methodology for defining the problem adds statistical knowledge of the problem, reducing the chance of an incorrect assessment of the issue as defined by the customer and scope documents.
Six Sigma at many organizations simply means a measure of quality that strives for near perfection. Six Sigma is a disciplined, data-driven approach and methodology for eliminating defects (driving toward six standard deviations between the mean and the nearest specification limit) in any process – from manufacturing to transactional and from product to service.

The statistical representation of Six Sigma describes quantitatively how a process is performing. To achieve Six Sigma, a process must not produce more than 3.4 defects per million opportunities. A Six Sigma defect is defined as anything outside of customer specifications. A Six Sigma opportunity is then the total quantity of chances for a defect. Process sigma can easily be calculated using a Six Sigma calculator.

The fundamental objective of the Six Sigma methodology is the implementation of a measurement-based strategy that focuses on process improvement and variation reduction through the application of Six Sigma improvement projects. 
This is accomplished through the use of two Six Sigma sub-methodologies: 
DMAIC and DMADV. 

The Six Sigma DMAIC process (define, measure, analyze, improve, control) is an improvement system for existing processes falling below specification and looking for incremental improvement. 

The Six Sigma DMADV process (define, measure, analyze, design, verify) is an improvement system used to develop new processes or products at Six Sigma quality levels. It can also be employed if a current process requires more than just incremental improvement. 

Both Six Sigma processes are executed by Six Sigma Green Belts and Six Sigma Black Belts, and are overseen by Six Sigma Master Black Belts.

According to the Six Sigma Academy, Black Belts save companies approximately $230,000 per project and can complete four to six projects per year. (Given that the average Black Belt salary is $80,000 in the United States, that is a fantastic return on investment.) General Electric, one of the most successful companies implementing Six Sigma, has estimated benefits on the order of $10 billion during the first five years of implementation. GE first began Six Sigma in 1995 after Motorola and Allied Signal blazed the Six Sigma trail. Since then, thousands of companies around the world have discovered the far reaching benefits of Six Sigma.

Sunday, April 6, 2014

Ishikawa FishBone Cause Effect

Ishikawa FishBone Cause Effect diagram
Ishikawa diagrams were popularized by Kaoru Ishikawa[3] in the 1960s, who pioneered quality management processes in the Kawasaki shipyards, and in the process became one of the founding fathers of modern management.

The basic concept was first used in the 1920s, and is considered one of the seven basic tools of quality control.[4] It is known as a fishbone diagram because of its shape, similar to the side view of a fish skeleton.

Mazda Motors famously used an Ishikawa diagram in the development of the Miata sports car, where the required result was "Jinba Ittai" (Horse and Rider as One — jap. 人馬一体). The main causes included such aspects as "touch" and "braking" with the lesser causes including highly granular factors such as "50/50 weight distribution" and "able to rest elbow on top of driver's door". Every factor identified in the diagram was included in the final design.

Causes

Causes in the diagram are often categorized, such as to the 6 M's, described below. Cause-and-effect diagrams can reveal key relationships among various variables, and the possible causes provide additional insight into process behavior. Causes can be derived from brainstorming sessions. Causes can be traced back to root causes with the 5 Whys technique.

The 5 Whys is an iterative question-asking technique used to explore the cause-and-effect relationships underlying a particular problem.[1] The primary goal of the technique is to determine the root cause of a defect or problem. (The "5" in the name derives from an empirical observation on the number of iterations typically required to resolve the problem.)

Example

    The vehicle will not start. (the problem)

    Why? - The battery is dead. (first why)
    Why? - The alternator is not functioning. (second why)
    Why? - The alternator belt has broken. (third why)
    Why? - The alternator belt was well beyond its useful service life and not     replaced. (fourth why)
    Why? - The vehicle was not maintained according to the recommended service     schedule. (fifth why, a root cause)

Start maintaining the vehicle according to the recommended service schedule. (possible 5th Why solution)

The questioning for this example could be taken further to a sixth, seventh, or higher level, but five iterations of asking why is generally sufficient to get to a root cause. The key is to encourage the trouble-shooter to avoid assumptions and logic traps and instead trace the chain of causality in direct increments from the effect through any layers of abstraction to a root cause that still has some connection to the original problem. Note that, in this example, the fifth why suggests a broken process or an alterable behaviour, which is indicative of reaching the root-cause level.

It is interesting to note that the last answer points to a process. This is one of the most important aspects in the 5 Why approach - the real root cause should point toward a process that is not working well or does not exist.

Untrained facilitators will often observe that answers seem to point towards classical answers such as not enough time, not enough investments, or not enough manpower. These answers may be true, but they are out of our control.

Therefore, instead of asking the question why?, ask why did the process fail? A key phrase to keep in mind in any 5 Why exercise is "people do not fail, processes do".


Saturday, October 12, 2013

Design of Experiment

Design of Experiment: (DOE)

The term experiment is defined as the systematic procedure carried out under controlled conditions in order to discover an unknown effect, to test or establish a hypothesis, or to illustrate a known effect. When analyzing a process, experiments are often used to evaluate which process inputs have a significant impact on the process output, and what the target level of those inputs should be to achieve a desired result (output). Experiments can be designed in many different ways to collect this information. Design of Experiments (DOE) is also referred to as Designed Experiments or Experimental Design - all of the terms have the same meaning.
Experimental design can be used at the point of greatest leverage to reduce design costs by speeding up the design process, reducing late engineering design changes, and reducing product material and labor complexity. Designed Experiments are also powerful tools to achieve manufacturing cost savings by minimizing process variation and reducing rework, scrap, and the need for inspection.

Components of Experimental Design

Consider the following diagram of a cake-baking process (Figure 1). There are three aspects of the process that are analyzed by a designed experiment:
  • Factors, or inputs to the process. Factors can be classified as either controllable or uncontrollable variables. In this case, the controllable factors are the ingredients for the cake and the oven that the cake is baked in. The controllable variables will be referred to throughout the material as factors. Note that the ingredients list was shortened for this example - there could be many other ingredients that have a significant bearing on the end result (oil, water, flavoring, etc). Likewise, there could be other types of factors, such as the mixing method or tools, the sequence of mixing, or even the people involved. People are generally considered a Noise Factor (see the glossary) - an uncontrollable factor that causes variability under normal operating conditions, but we can control it during the experiment using blocking and randomization. Potential factors can be categorized using the Fishbone Chart (Cause & Effect Diagram) available from the Toolbox.
  • Levels, or settings of each factor in the study. Examples include the oven temperature setting and the particular amounts of sugar, flour, and eggs chosen for evaluation.
  • Response, or output of the experiment. In the case of cake baking, the taste, consistency, and appearance of the cake are measurable outcomes potentially influenced by the factors and their respective levels. Experimenters often desire to avoid optimizing the process for one response at the expense of another. For this reason, important outcomes are measured and analyzed to determine the factors and their settings that will provide the best overall outcome for the critical-to-quality characteristics - both measurable variables and attributes that can be assessed.


Purpose of Experimentation

Designed experiments have many potential uses in improving processes and products, including:

  • Comparing Alternatives. In the case of our cake-baking example, we might want to compare the results from two different types of flour. If it turned out that the flour from different vendors was not significant, we could select the lowest-cost vendor. If flour were significant, then we would select the best flour. The experiment(s) should allow us to make an informed decision that evaluates both quality and cost.
  • Identifying the Significant Inputs (Factors) Affecting an Output (Response) - separating the vital few from the trivial many. We might ask a question: "What are the significant factors beyond flour, eggs, sugar and baking?"
  • Achieving an Optimal Process Output (Response). "What are the necessary factors, and what are the levels of those factors, to achieve the exact taste and consistency of Mom's chocolate cake?
  • Reducing Variability. "Can the recipe be changed so it is more likely to always come out the same?"
  • Minimizing, Maximizing, or Targeting an Output (Response). "How can the cake be made as moist as possible without disintegrating?"
  • Improving process or product "Robustness" - fitness for use under varying conditions. "Can the factors and their levels (recipe) be modified so the cake will come out nearly the same no matter what type of oven is used?"
  • Balancing Trade offs when there are multiple Critical to Quality Characteristics (CTQC's) that require optimization. "How do you produce the best tasting cake with the simplest recipe (least number of ingredients) and shortest baking time?"

Benchmarking

Benchmarking is the process of comparing one's business processes and performance metrics to industry bests or best practices from other industries. Dimensions typically measured are quality, time and cost. In the process of best practice benchmarking, management identifies the best firms in their industry, or in another industry where similar processes exist, and compares the results and processes of those studied (the "targets") to one's own results and processes. In this way, they learn how well the targets perform and, more importantly, the business processes that explain why these firms are successful.

What is Benchmarking
Benchmarking is the process of determining who is the very best, who sets the standard, and what that standard is. In baseball, you could argue that seven consecutive World Series Championships made the New York Yankees the benchmark.

Once we decide what to benchmark, and how to measure it, the object is to figure out how the winner got to be the best and determine what we have to do to get there.

Checksheets

Checksheets:
he check sheet is a form (document) used to collect data in real time at the location where the data is generated. The data it captures can be quantitative or qualitative. When the information is quantitative, the check sheet is sometimes called a tally sheet.[1]
The check sheet is one of the so-called Seven Basic Tools of Quality Control

Kaoru Ishikawa identified five uses for check sheets in quality control:[3]
  • To check the shape of the probability distribution of a process
  • To quantify defects by type
  • To quantify defects by location
  • To quantify defects by cause (machine, worker)
  • To keep track of the completion of steps in a multistep procedure (in other words, as a checklist)


A Check Sheet is a tool to collect both qualitative and quantitative facts about quality problems. When it is used to collect quantitative data, then known as tally sheet
“A tally sheet that can be used as a checklist when gathering data”
This is an effective tool from one of the 7 basic quality tools, both to prevent and detect problems by having structured valuable data about quality problems.
Differentiating with check list:
Some professional’s gets confused in check sheet and checklist. Check sheet is not a check list, checklist is basically listing of items need to be considered for the purpose of accuracy and completeness.
For example, maintaining a daily to-do task list is a good example of checklist while the check sheet is a collection of facts about a problem categorized by their cause, types, and/or location
Following table further explains the difference between check sheet and checklist:
Check SheetCheck List
Check sheet conveys information about frequency of problems by type, causes and/or locationThe Checklist is used to include all the necessary steps need to follow to ensure the accuracy and completeness of a work product or process. The Checklist can be used while working on a check sheet to ensure its accuracy. For example, what steps need to follow to develop check sheet while collecting real time data
It is normally developed and agreed by the team members as per need of the project. For example sometimes team chooses to develop it to count the frequency for the source of the problem, alternatively team can choose to capture frequency of the data categorised by causes. In other words, check sheet is customized by a team.For a process, Checklist structure generally comes from the documented standards. Another checklist like to-do list comes from other influences, like someone is preparing to-do list as per expectations set.
These is a tool to record facts about interruptions or problems as a result of a quality control processThis is a tool to record what steps are required to fulfil an objective.
Where It Is Used?
Check sheet is one of the tools from 7 basic quality tools, and used in “Plan Quality” and “Control Quality as a Tool & Technique.  Here, my basic objective is to explain the check sheet in the context of these two processes.
While planning a project, past projects document records are used as an input to identify the process improvements to know where sources and causes of defects encountered and where we may need to do efforts to prevent them in the current project. For example, we are using the same team which was involved in the previous project, these factual data can help us to identify how they are collectively executing a process and at what point we can prevent defects in work products.
Like past projects check sheet shows that many defects encountered under category of “misinterpretation of customer requirements” then we may result in a process improvement plan for “Collect Requirements” process. In addition, quality policies in quality management plan and metrics can be designed to measure future work performance and processes.

Check sheet is used as a Tool & Technique in “Control quality process to know about frequencies of problem in a format agreed by the team.

Example Check Sheet
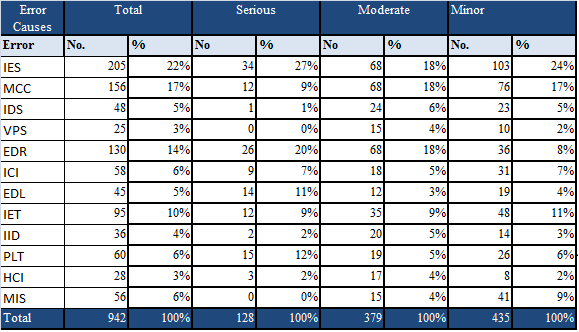
In order to understand the concept I am taking an example that may be used in software project, here I am choosing to show the check sheet in terms of frequencies of quality problems categorized by their causes.
A test team member is evaluating work products to detect problems from the specifications. The team may choose to categorize data about quality problems in following categories:
Categories suggested by Roger S. Pressman:
  1. Incomplete or erroneous specification (IES)
  2. Misinterpretation of customer communication (MCC)
  3. Intentional deviation from specifications (IDS)
  4. Violations of programming standards. (VPS)
  5. Error in data representations (EDR)
  6. Inconsistent component interface (ICI)
  7. Error in design logic (EDL)
  8. Incomplete or erroneous testing (IET)
  9. Inaccurate or inconsistent documentation (IID)
  10. Error in programming language translation of design (PLT)
  11. Ambiguous or inconsistent human/computer interface (HCI)
  12. Miscellaneous (MIS)

While examination of work product test team member, team member assesses the defects and enter the frequencies in their respective category of causes like:
Check Sheet suggested by Roger S. Pressman in software engineering a practitioner’s approach:
Untitled
Benefits of Check Sheet
Main objective of check sheet is to produce quantitative data about quality problems and use as an input of other seven quality tools like Histogram and Pareto analysis that will be discussed in my upcoming articles.
In addition check sheet is also used to collect qualitative data like no of interruptions that comes from intuition, judgement and feeling of observer.
In short it is an effective tool to collect both quantitative and qualitative data about quality problems.
==========================================================================

The Check Sheet is a simple document that is used for collecting data in real time and at the location where the data is generated. The document is typically a blank form that is designed for the quick, easy, and efficient recording of the desired information, which can be either quantitative or qualitative. When the information is quantitative, the check sheet is sometimes called a tally sheet. The check sheet is one of the seven basic tools of quality control made popular by Dr. Kaoru Ishikawa.


Check Sheet used for Plan Quality Management purpose:
While planning a project, past projects document records are used as an input to identify the process improvements to know where sources and causes of defects encountered and where we may need to do efforts to prevent them in the current project. For example, we are using the same team which was involved in the previous project, these factual data can help us to identify how they are collectively executing a process and at what point we can prevent defects in work products.
Like past projects check sheet shows that many defects encountered under category of “misinterpretation of customer requirements” then we may result in a process improvement plan for “Collect Requirements” process. In addition, quality policies in quality management plan and metrics can be designed to measure future work performance and processes.
Check Sheet used for Control Quality purpose:
Check sheet is used as a Tool & Technique in “Control quality process to know about frequencies of problem in a format agreed by the team.

A defining characteristic of a check sheet is that data is recorded by making marks (“checks”) on it. A typical check sheet is divided into regions, and marks made in different regions have different significance. Data is read by observing the location and number of marks on the sheet. Four basic types of check sheets include:
Classification check sheet: A trait such as a defect must be classified into a category. If you just kept track of the total defects, you would know that you had 101 total defects. That is somewhat useful but that, in and of itself, does not provide much insight as to which day is the worst day or which source of defects is in the worst shape, etc. With a classification check sheet, it provides a visual overview of the problem areas.


Defect location check sheet: The physical location of a trait is indicated on a picture, or illustration of a part or item being evaluated. Instead of just keeping track of the number of defects, the defect location check sheet can sometimes reveal an area of the product that tends to see most of the defects. Once this is known, the team can go back to the process to see what it is about the upper right-hand corner of the product that is causing the defects.

Frequency check sheet: The presence or absence of a trait or combination of traits is indicated. Also, number of occurrences of a trait on a part can be indicated. Notice that if you just tracked the number of defects, you may not realize that Wrong Color has the highest frequency of occurrence. Furthermore, if Wrong Color was not broken down further, you might not realize that GREEN is giving you the most defects.

Measurement scale check sheet: A measurement scale is divided into intervals and measurements are indicated by checking an appropriate interval.