The relations diagram shows cause–and–effect relationships.
Also called: interrelationship diagram or digraph, network diagram
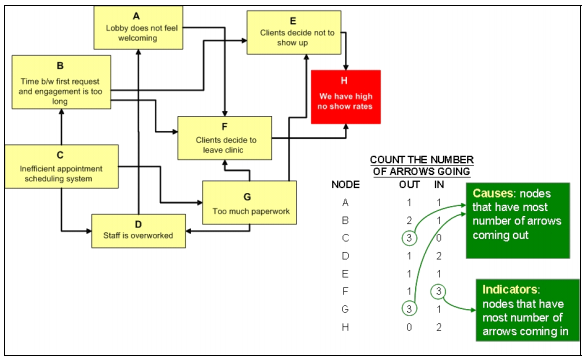
Below is a sample inter-relationship digraph for the problem of high no-show rates. The basic steps are as follows:
1. Brainstorm the potential causes of the problem, group similar concepts together,
and label these nodes A, B, C, etc.
2. Identify cause and effect, and draw directional arrows. For example, too much
paperwork (node G) leads to an overworked staff (node D), and consequently an
unfriendly environment for clients and staff (node A). There may be cases when
arrows point both ways, which typically indicates a vicious cycle. Again, if the
problem is too complex, break up the diagram into manageable parts.
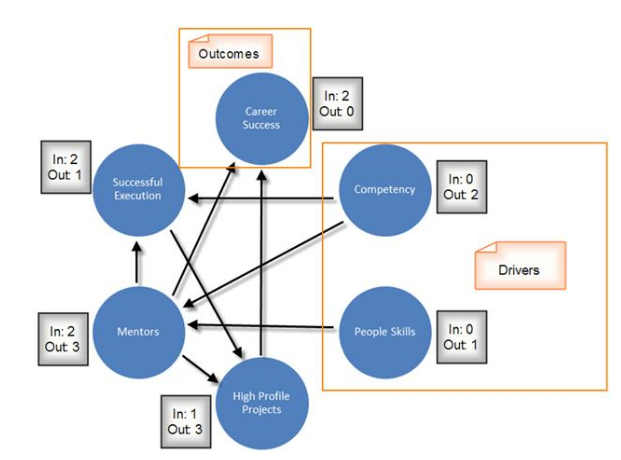
3. Count the number of arrows coming into and going out of each node.
These counts determine:
• the root causes —the nodes that have the most number of arrows coming out of them,
• and the key effect, indicators or outcomes —the nodes that have the most number of arrows going into them.
Diagram

Also called: interrelationship diagram or digraph, network diagram
When to Use a Relations Diagram
- When trying to understand links between ideas or cause–and–effect relationships, such as when trying to identify an area of greatest impact for improvement.
- When a complex issue is being analyzed for causes.
- After generating an affinity diagram, cause–and–effect diagram or tree diagram, to more completely explore the relations of ideas.
Below is a sample inter-relationship digraph for the problem of high no-show rates. The basic steps are as follows:
1. Brainstorm the potential causes of the problem, group similar concepts together,
and label these nodes A, B, C, etc.
2. Identify cause and effect, and draw directional arrows. For example, too much
paperwork (node G) leads to an overworked staff (node D), and consequently an
unfriendly environment for clients and staff (node A). There may be cases when
arrows point both ways, which typically indicates a vicious cycle. Again, if the
problem is too complex, break up the diagram into manageable parts.
3. Count the number of arrows coming into and going out of each node.
These counts determine:
• the root causes —the nodes that have the most number of arrows coming out of them,
• and the key effect, indicators or outcomes —the nodes that have the most number of arrows going into them.
Diagram

No comments:
Post a Comment